Orbica platform
The Orbica Platform empowers data professionals to consolidate, analyse, model and curate geospatial data in a way that is meaningful, timely and collaborative without requiring in-depth GIS knowledge.
Client: Orbica
Roles: design strategy / interaction & UI design / user research / user testing / design system
Background
I joined a new product team at Orbica to help design their new B2B geospatial platform for seven months (June-Dec 2022). The core product team consists of the CEO, Innovation & Technology Lead, Platform Architecture Lead, Lead & Senior Software Developers, Delivery Manager, Lead UX Designer and Subject Matter Experts.
Orbica’s vision and mission are:
“We want to positively enhance billions of lives (mission) by democratising geospatial insights, enabling better decision making, ensuring a sustainable future for people and the planet. Empowering people to make critical decisions using digital geography in a changing world (vision).” – Kurt Janssen, CEO.
What is a geospatial project?
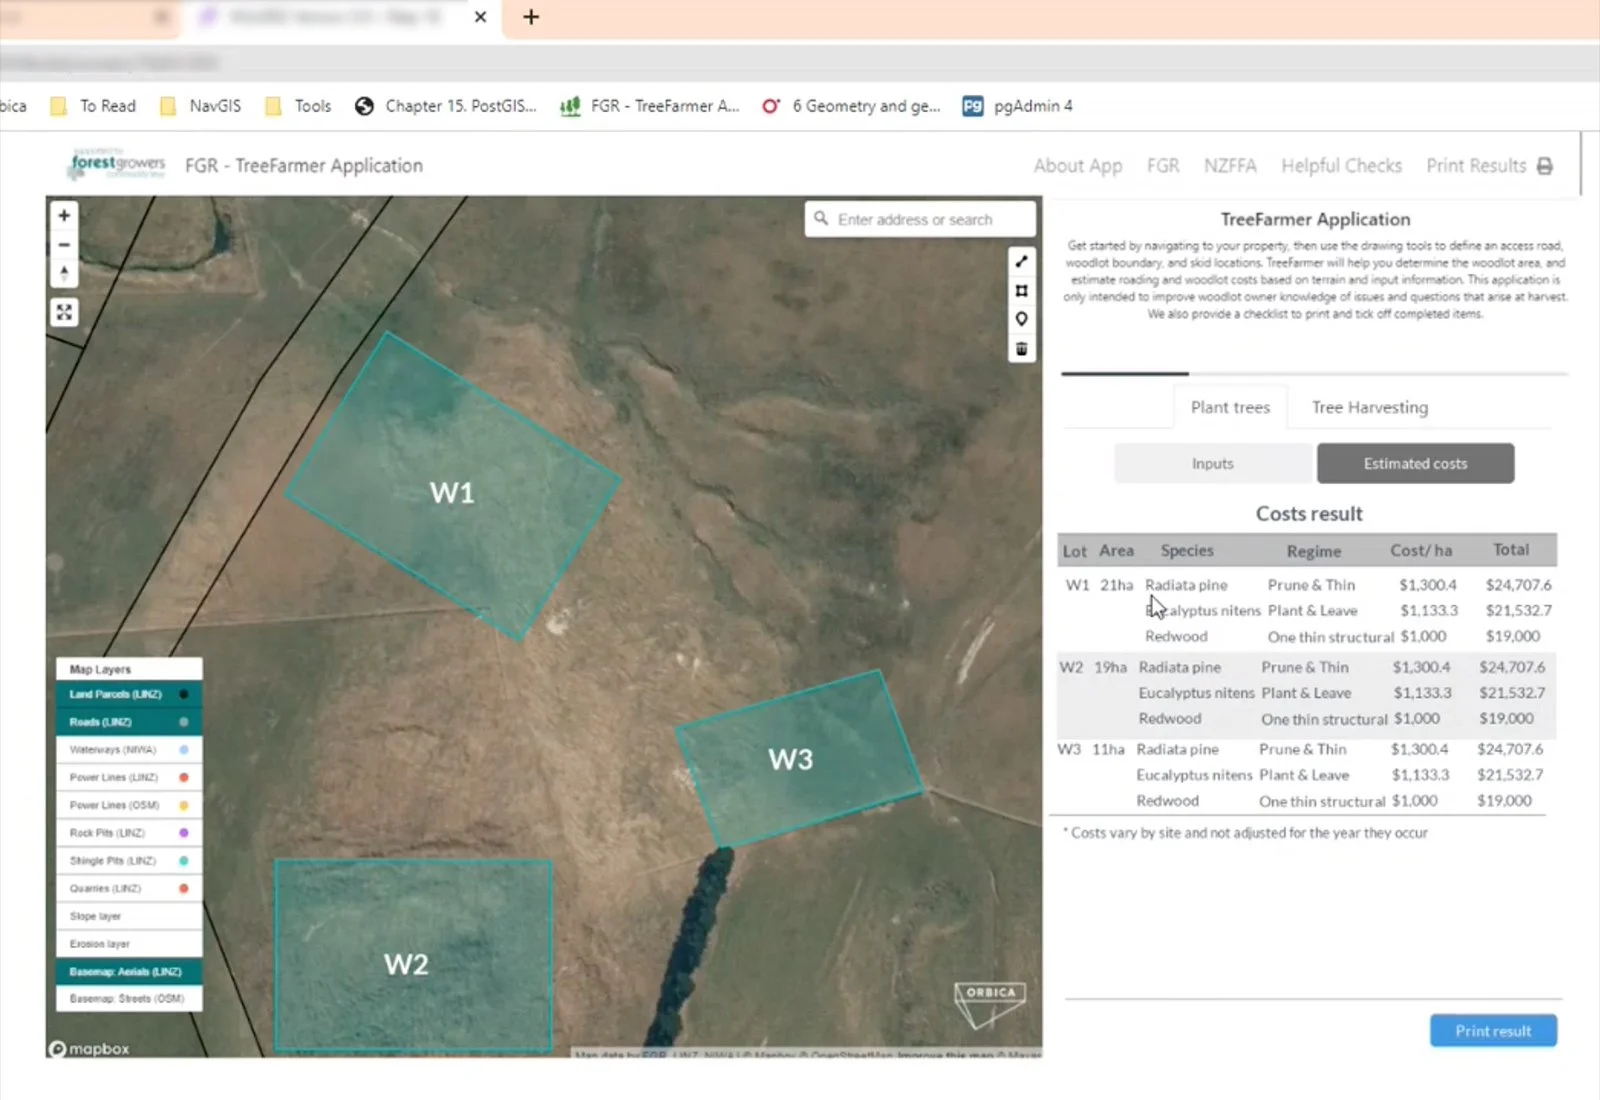
It is any kinds of project where geo-enriched data are used to do spatial and temporal analysis or modeling in order to produce analysis-ready data product. Typically these analysis-ready or curated data would be presented through a digital interface like an app, a dashboard or a PDF report, which are used by stakeholders to make decisions with large-scale impacts around lands, water, civic policies, health and so on.
UX Design Strategy
As the Lead UX Designer my main job was to help the team prioritise what product experiences that Orbica should build for the platform in its three initial releases: Alpha (late 2022), Beta (early 2023) and First Release (2023), focusing mostly on the latter two releases. A portion of my time was also spent on sharing UX Design methodology and building the Orbica Design System.
discovery
The purpose of the discovery phase was mainly to align the core product team around the problem space in the GIS world, define Orbica's business goals and what product values we want to provide to the target users. We also needed to identify any high risk assumptions and validate them.
Due to the complexity of the project, I employed several discovery methodologies such as Lean UX Canvas, internal & external user interviews, Jobs to be Done framework and Customer Value Proposition workshop.
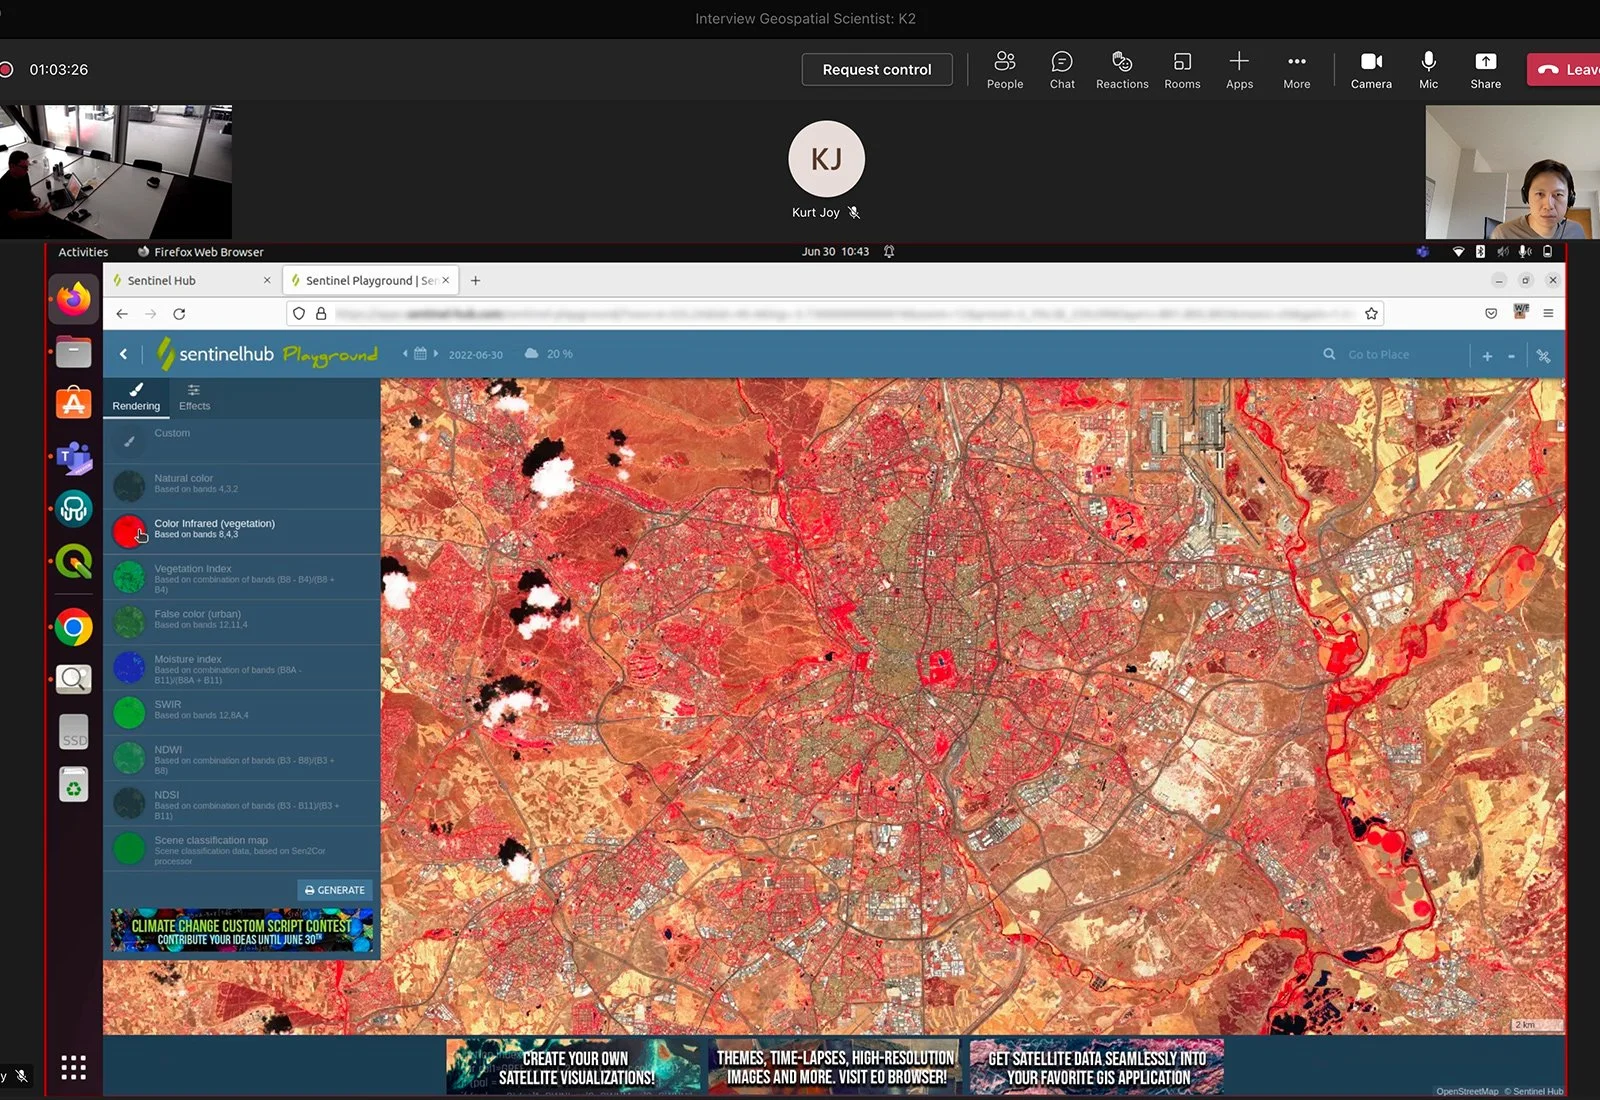
Internal Stakeholder & User Interviews
As a starting point I interviewed several key stakeholders and the internal staff consisting of a geologist, an AI data scientist, a senior back-end developer and a software administrator. These particular roles were recruited as proxies for Orbica’s main target market.
The Outcomes
By interviewing the internal staff I was able to gauge the team’s dynamics, their expectations of UX Design and most importantly understand the high level workflows in geospatial projects based on their respective roles.
Lean UX Canvas
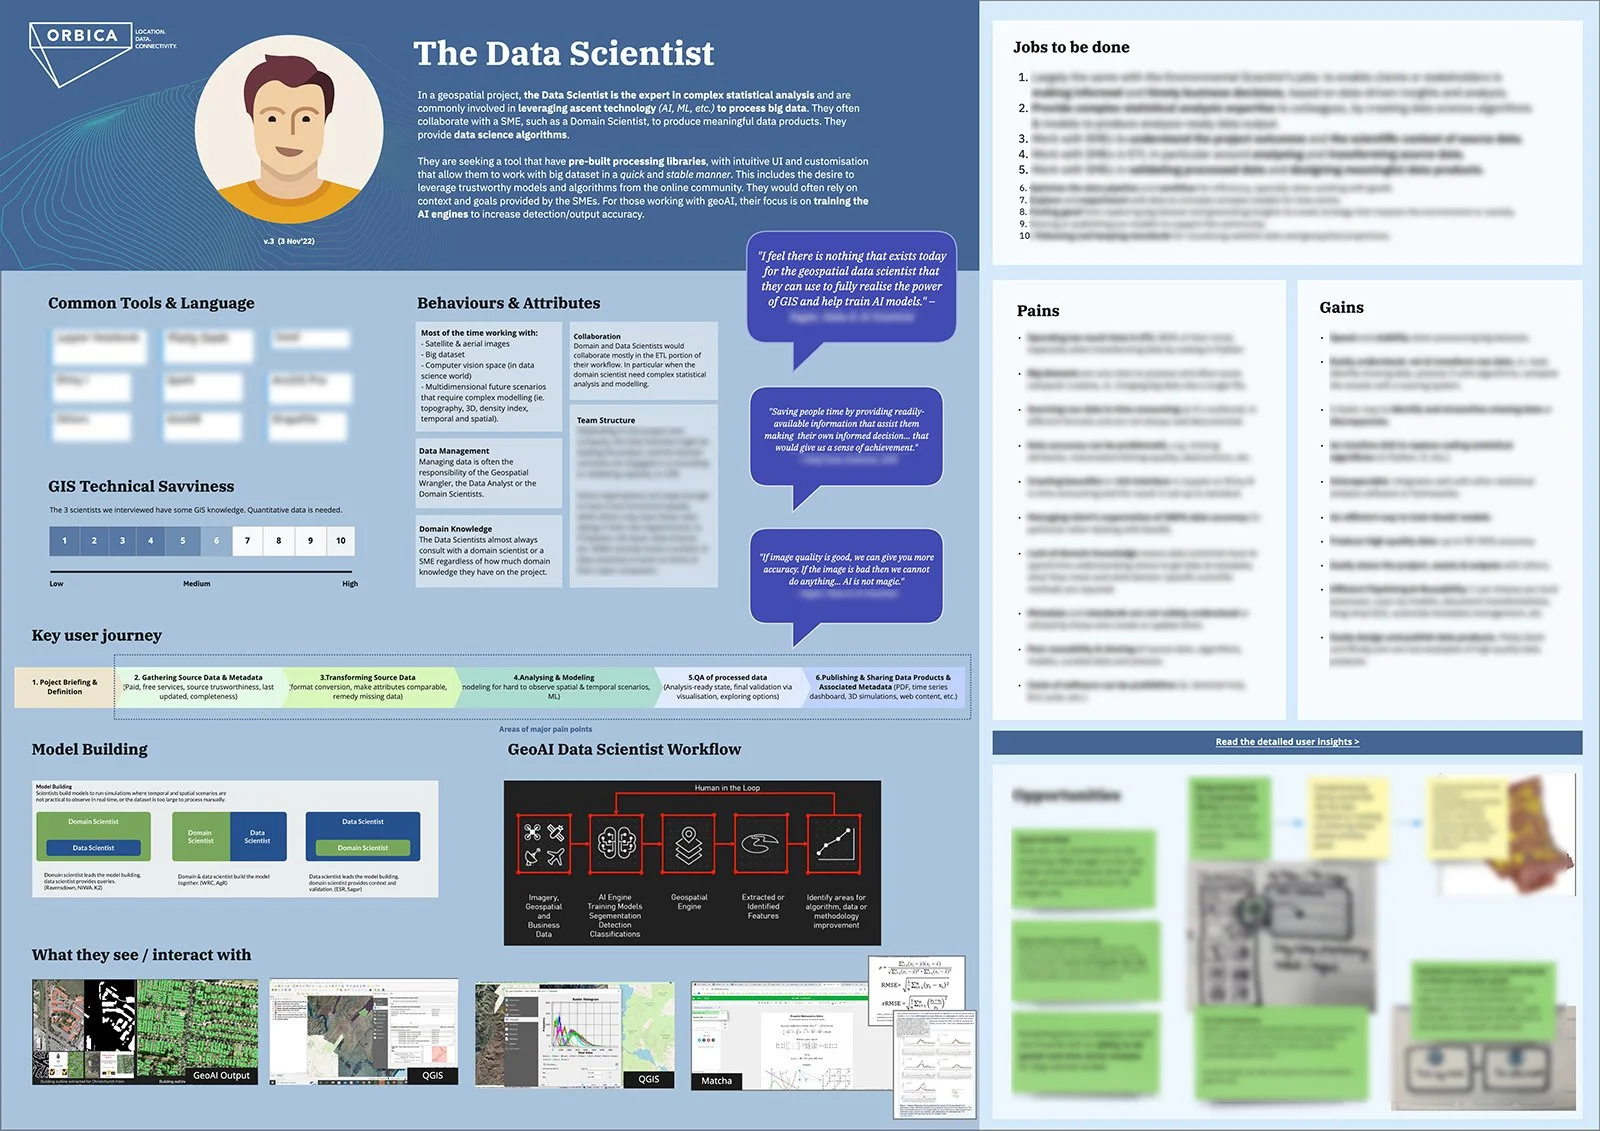
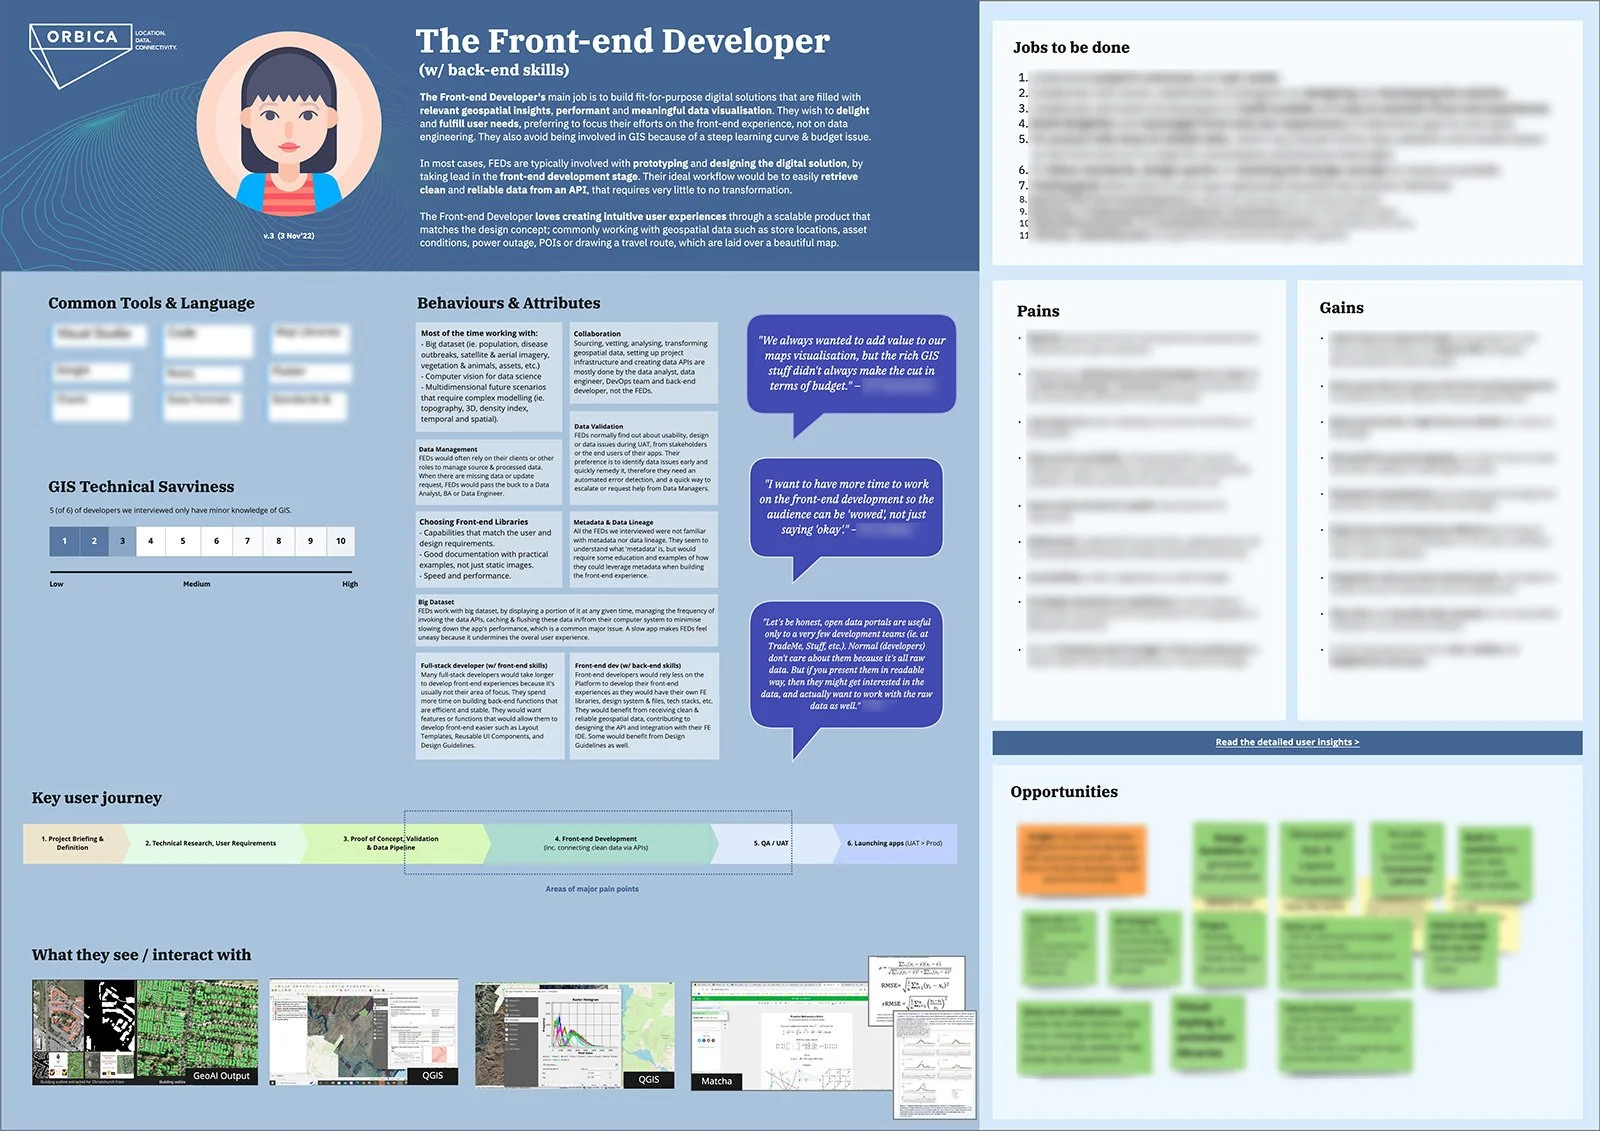
Using Lean UX Canvas we were able to align the core team members on our business goals, success metrics, user group priority and their goals. In particular, we identified about a dozen user personas. Insights from the internal and external user interviews helped us finalise the primary user group we wanted to target first, which are:
Environmental Scientist
Data Scientist
Front-end Developer
We wrote assumptive problem statements and their corresponding design hypotheses, for example:
“We believe that we will democratise geospatial data by ensuring that users can trust the data by understanding the metadata and lineage/history of the data.”
External User Interviews
I interviewed a dozen people from Crown institutions and commercial enterprises, who represented the domain scientist, data scientist, utility engineer and front-end developer personas to understand their workflows, pain points, goals, tools and wishlist.
To navigate through the large user groups and diverse needs, I synthesized the raw user research data through the lens of Jobs to be Done. We needed to fill in any knowledge gap and validate high risk assumptions, e.g. What are the most common analytical software used by scientists? Is there a pattern in their workflows, or are they completely different? How do users use metadata and manage their geospatial data?
We learnt key pain points such as:
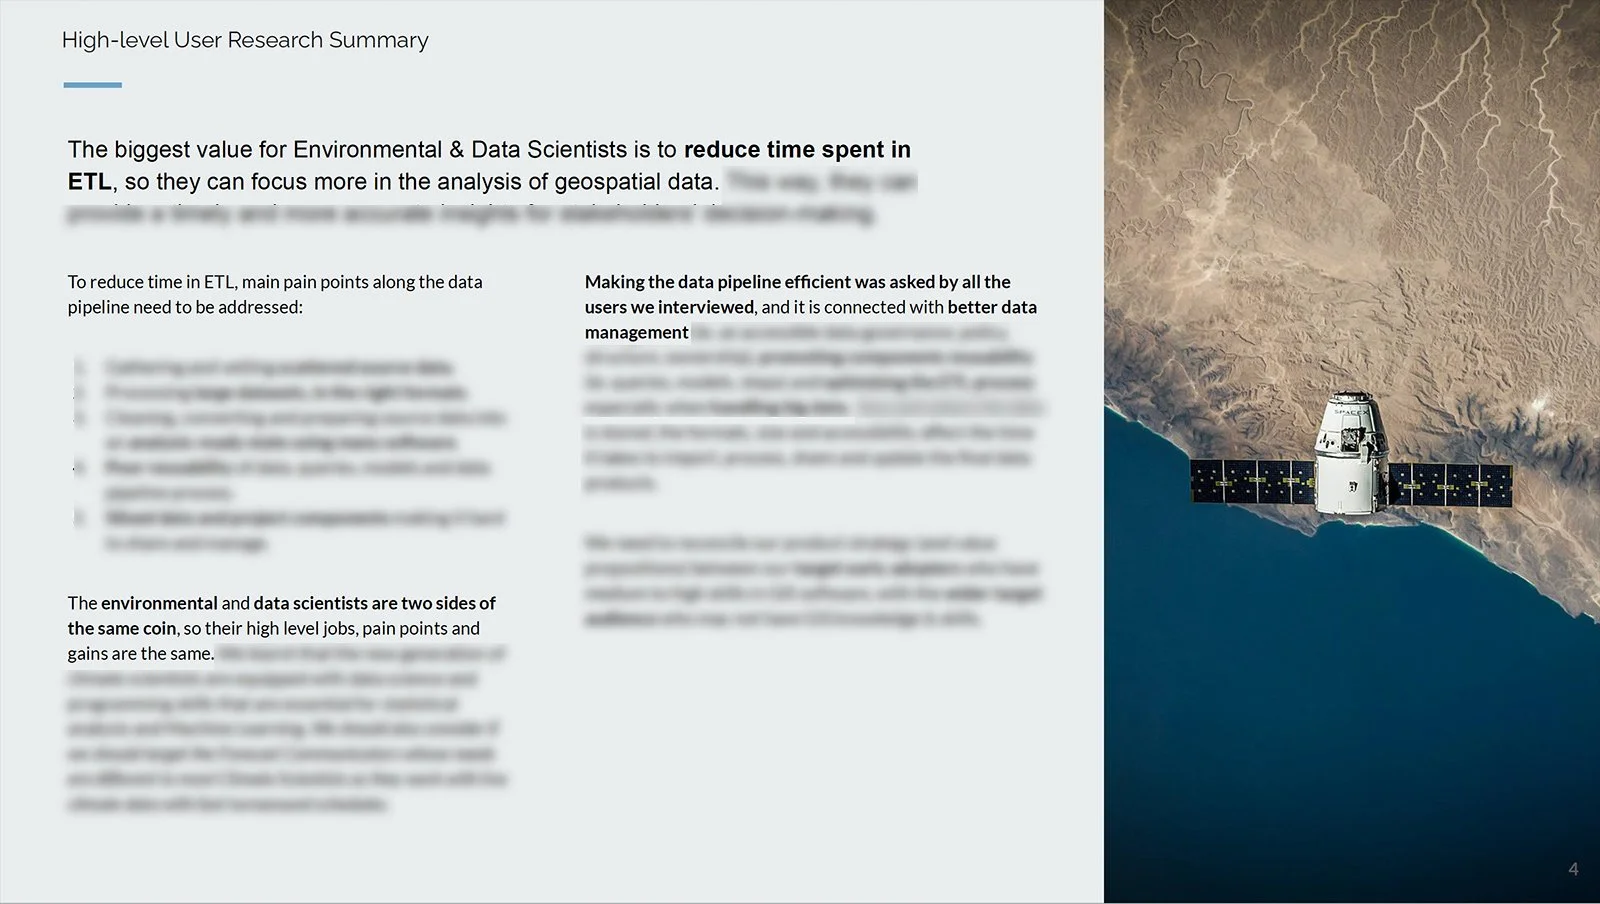
Scientists are speding too much time in ETL instead of in the scientific analysis and modeling.
Processing large datasets in the right formats with high quality/completeness, is time consuming.
Poor reusability of data, queries, models and data pipeline processes, forcing scientists to reinvent the wheel in most projects.
"If we create a new spatial layer, make it easy for us to put it on the repo for others to reuse… and not rebuild the data catalogue over and over again?" – Meteorological Agency
As a team we decided to prioritise the Environmental Scientist and Data Scientist personas first because we believed they would gain the most values out of the Orbica Platform. We also included the Front-end Developer persona in the primary user group because they are usually responsible for developing the front-end experience of a geospatial solution (e.g. website, dashboard or app).
“Scientists would have a good idea on what to do with the data, and how it is stored. But they may not have the knowledge of how to make these data usable and accessible by others." – SME
DEFINITION
Customer Value Proposition Workshop
The CVP workshop helped us come up with ideas based on the user’s jobs, pains and gains. We included earlier ideas from the Lean UX Canvas and after synthesizing them, we wrote user value propositions to help prioritise the product values strategically.
User Journey Mapping
By mapping the user journey, we were able to identify six user journey phases that the domain and data scientist’s go through when working on a geospatial project. They do diverge in terms of the software they use, the team’s GIS capability, the data infrastructure and governance. This is why the scientist’s approach to geospatial projects at times feel like the Wild Wild West, thus they need streamlining.
To accommodate these differences the Orbica Platform needs to support existing technology stacks and languages, be modular so a user can work on any phase non-linearly, and adhere to the Data Mesh philosophy to manage data governance and ownership well.
Information Architecture
The purpose of the Information Architecture activity was to help the team design the Platform’s content structure from the user’s perspective. It helps abstract a lot of the conversations which tend to get bogged down in the technical details. We also looked at naming convention such as differentiating between APIs, apps and plug-ins, SDK vs Toolkit, etc.
design
Design Principles as a guideline
In the design phase we looked a number of Design Principles to guide the back-end development and UI design. Here are some of them:
Secure
Supports authentication and authorisation of users, e.g. Single Sign-On.Scalable
Resources can be added or removed automatically to meet demand while minimising cost.
Automated
Allows changes via APIs and configuration to minimise manual deployments and human error.
Modular
Loosely coupled and interoperable with other tools/systems.
Informing the Product Roadmap
Secondly, I worked closely with the Innovation & Development Lead to inform the product roadmap with our UX findings, so that the Platform’s MVP should include these attributes:
Stability and fast processing time for big datasets.
Availability and completeness of source data.
Ability to reuse and share project components.
Ability to publish and curate data products independent of GIS capability.
Ease of integration with front-end framework through APIs and plug-ins.
Co-design Session
Co-designing was crucial because we could bring in different perspectives from the cross-functional team, many of whom have been thinking about the geospatial problem space for months, if not years. The team was asked to sketch out a storyboard that incorporated the overall user flow from logging into the Platform to sharing or exporting the final data product based on real scenarios. They were asked to reference the user value propositions, including ideas and attributes that we’d generated in the CVP workshop.
From Prototype to User Testing
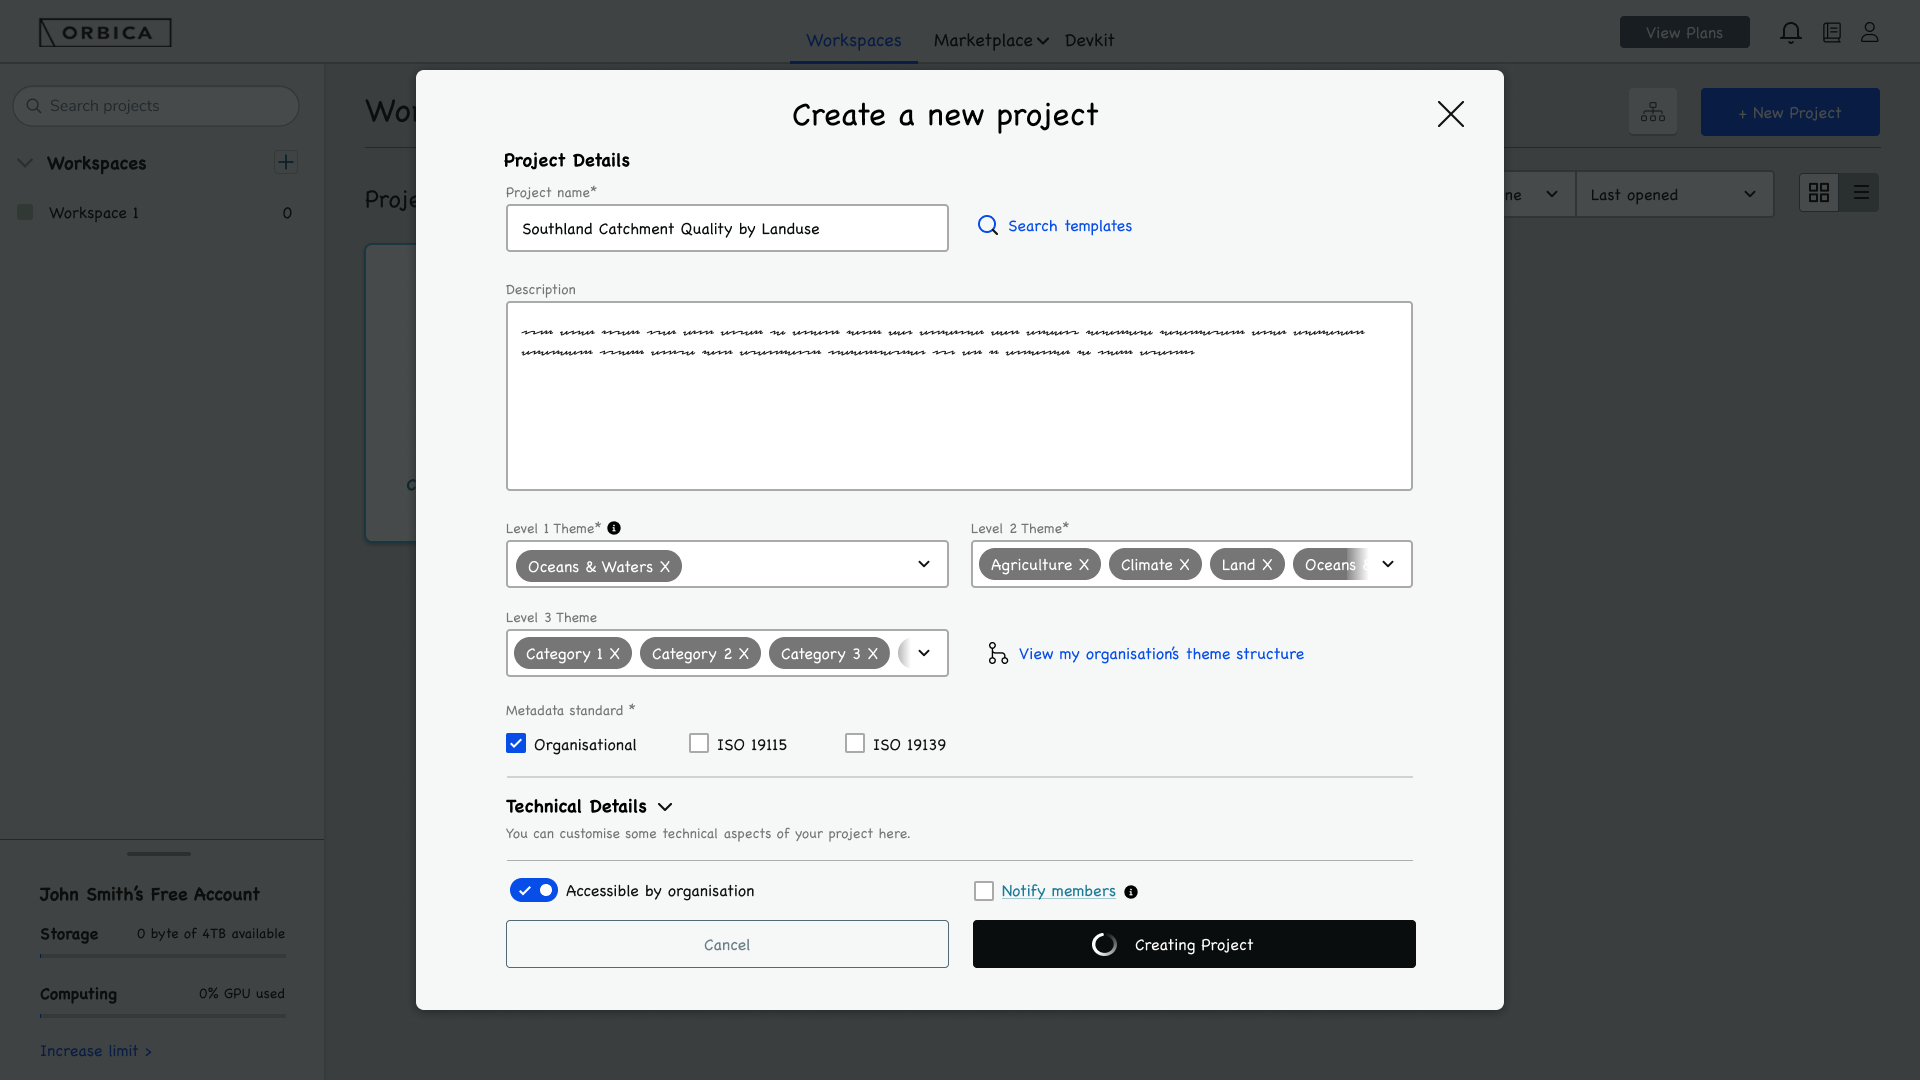
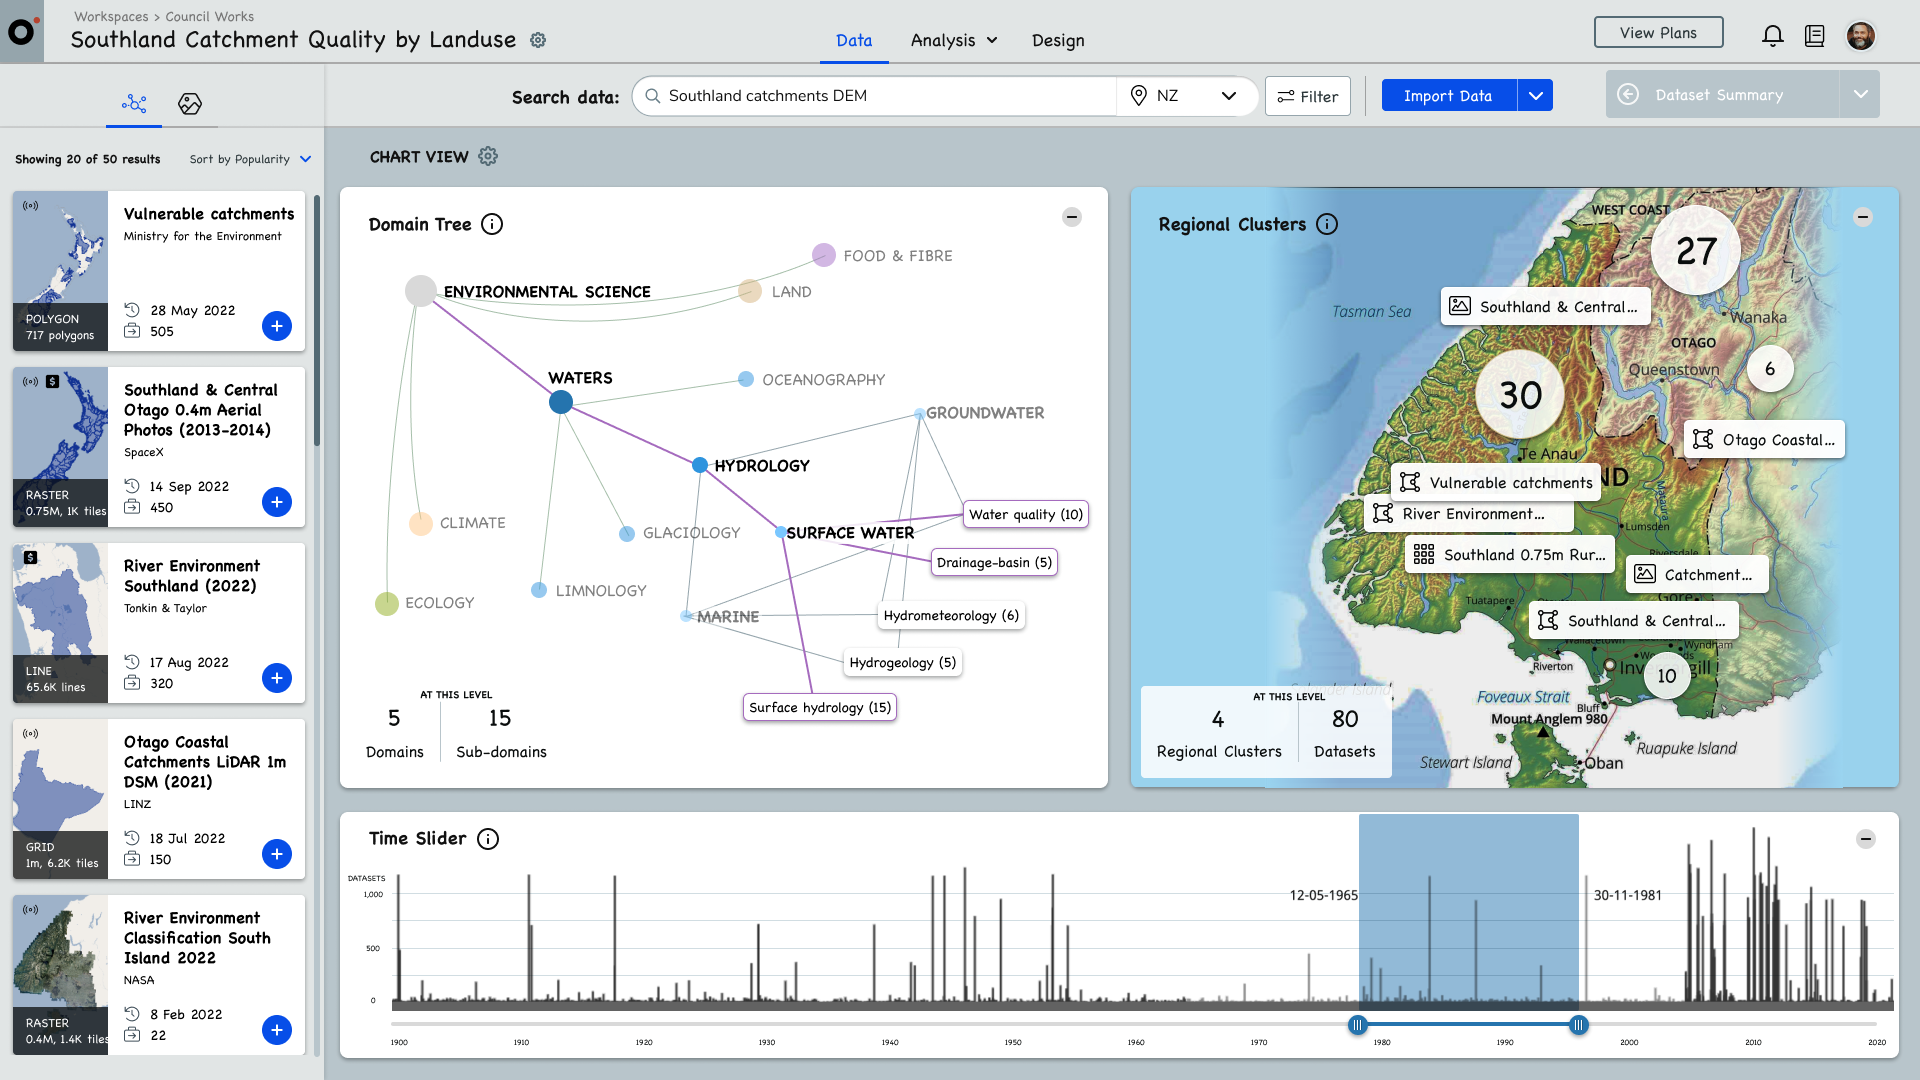
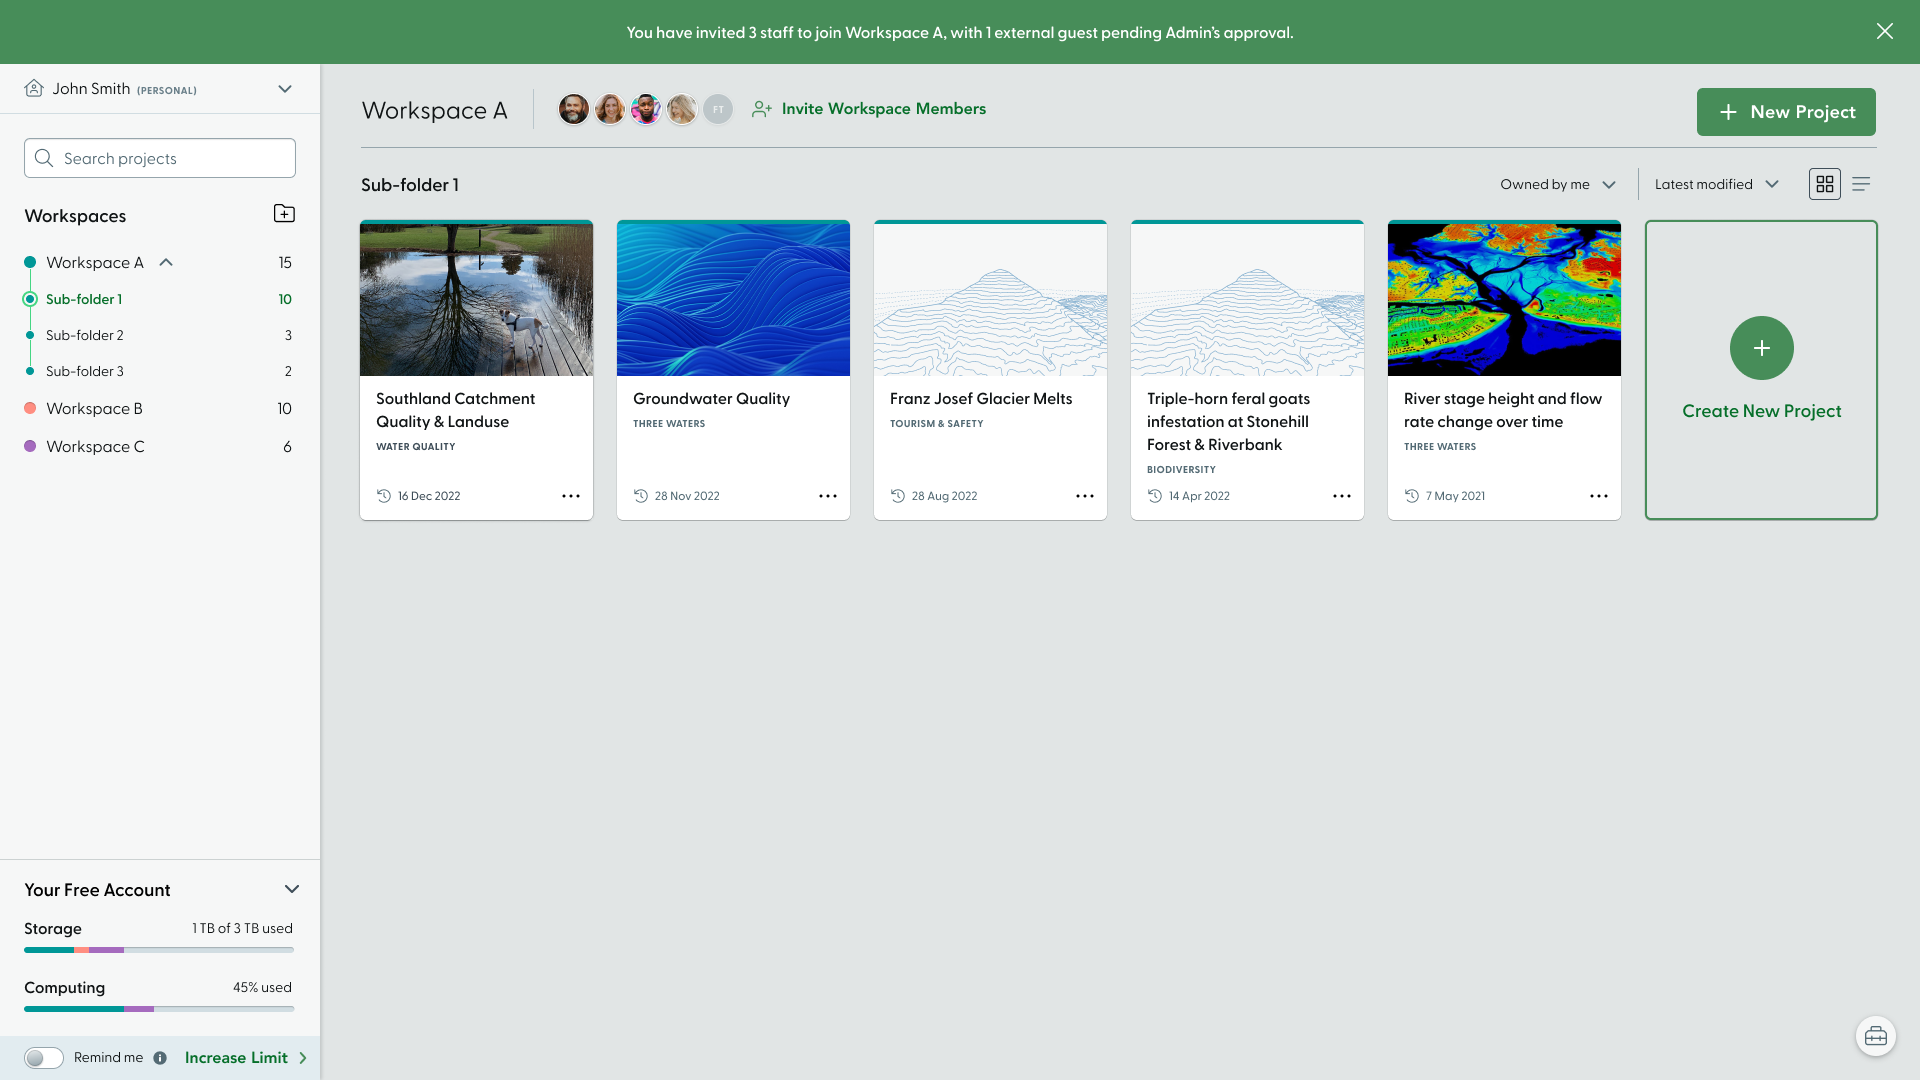
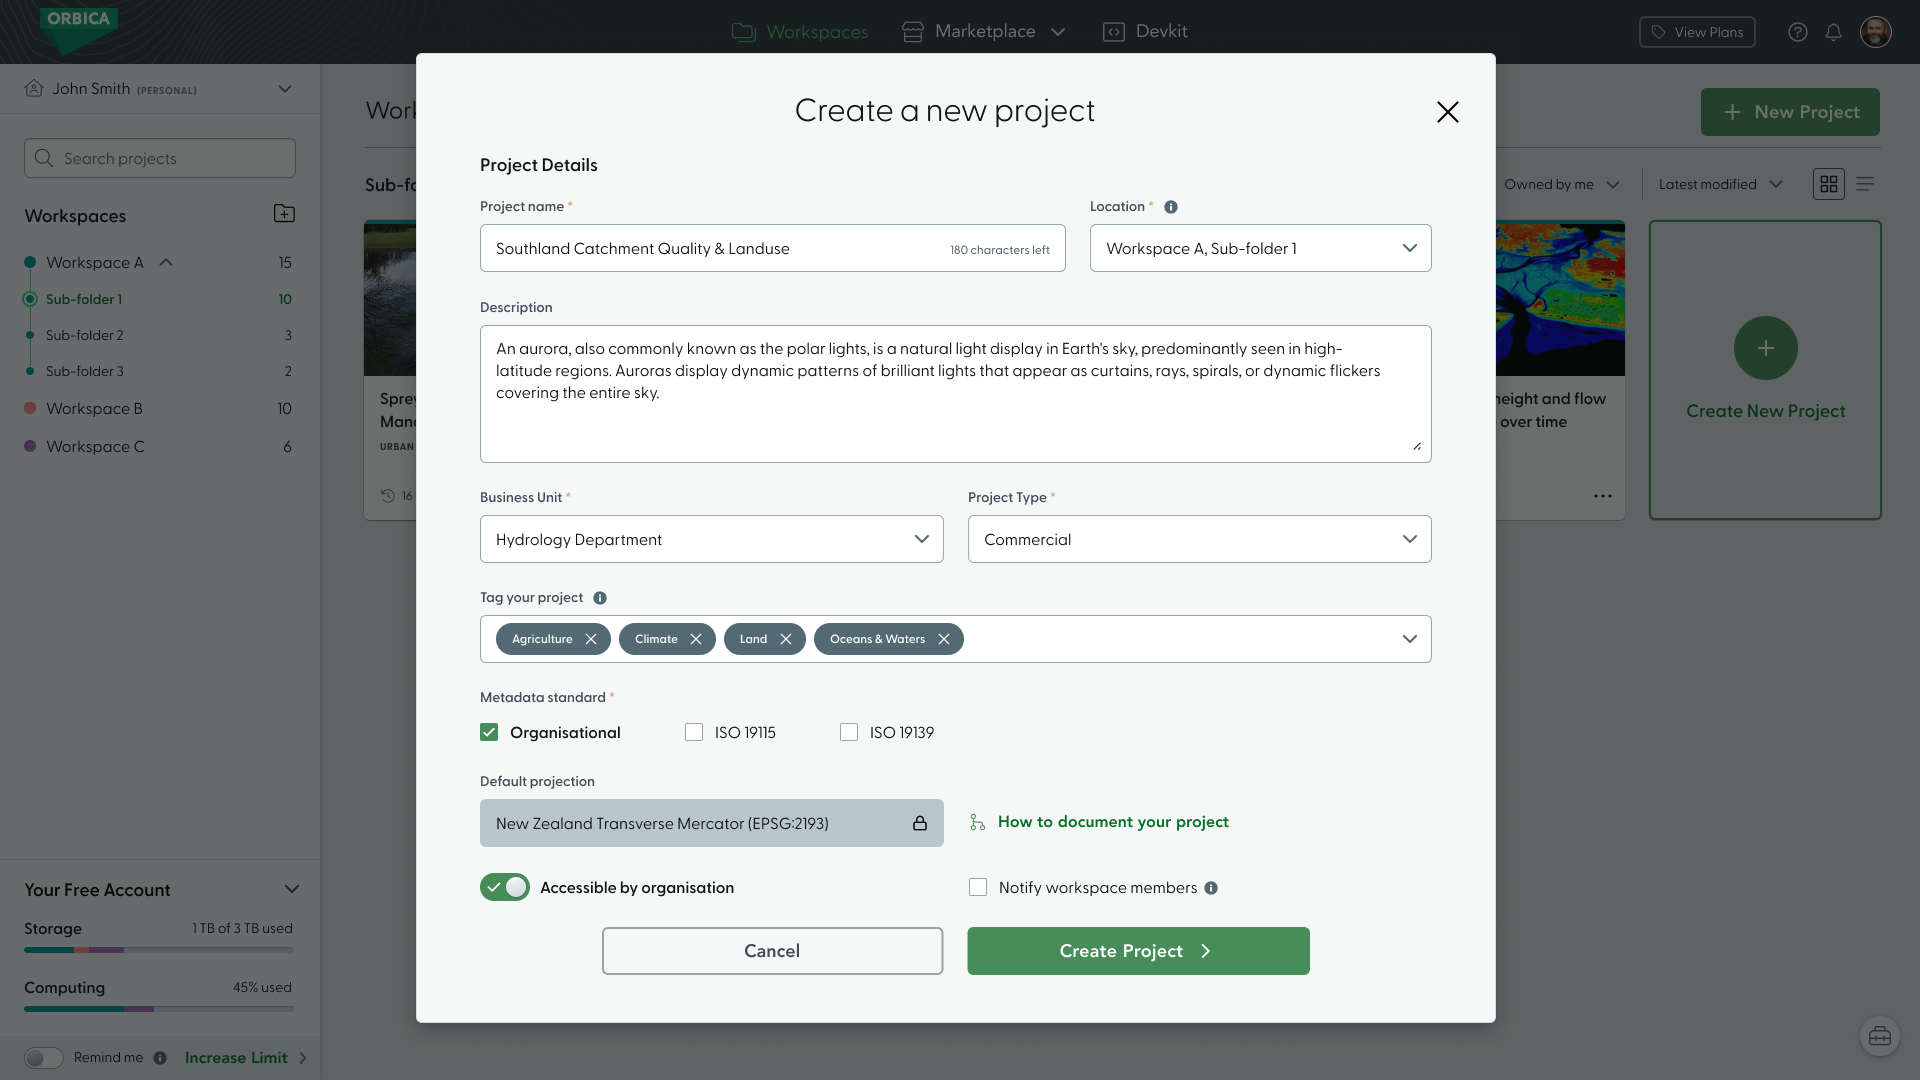
I then synthesised the selected ideas into a unified screen designs, which I built into a clickable prototype to test with the environmental and data scientists. The design was focused primarily on Phase 2-4 from the user journey as these experiences have the most complex interaction, and would be good candidates to test.
Creating a new geospatial project flow
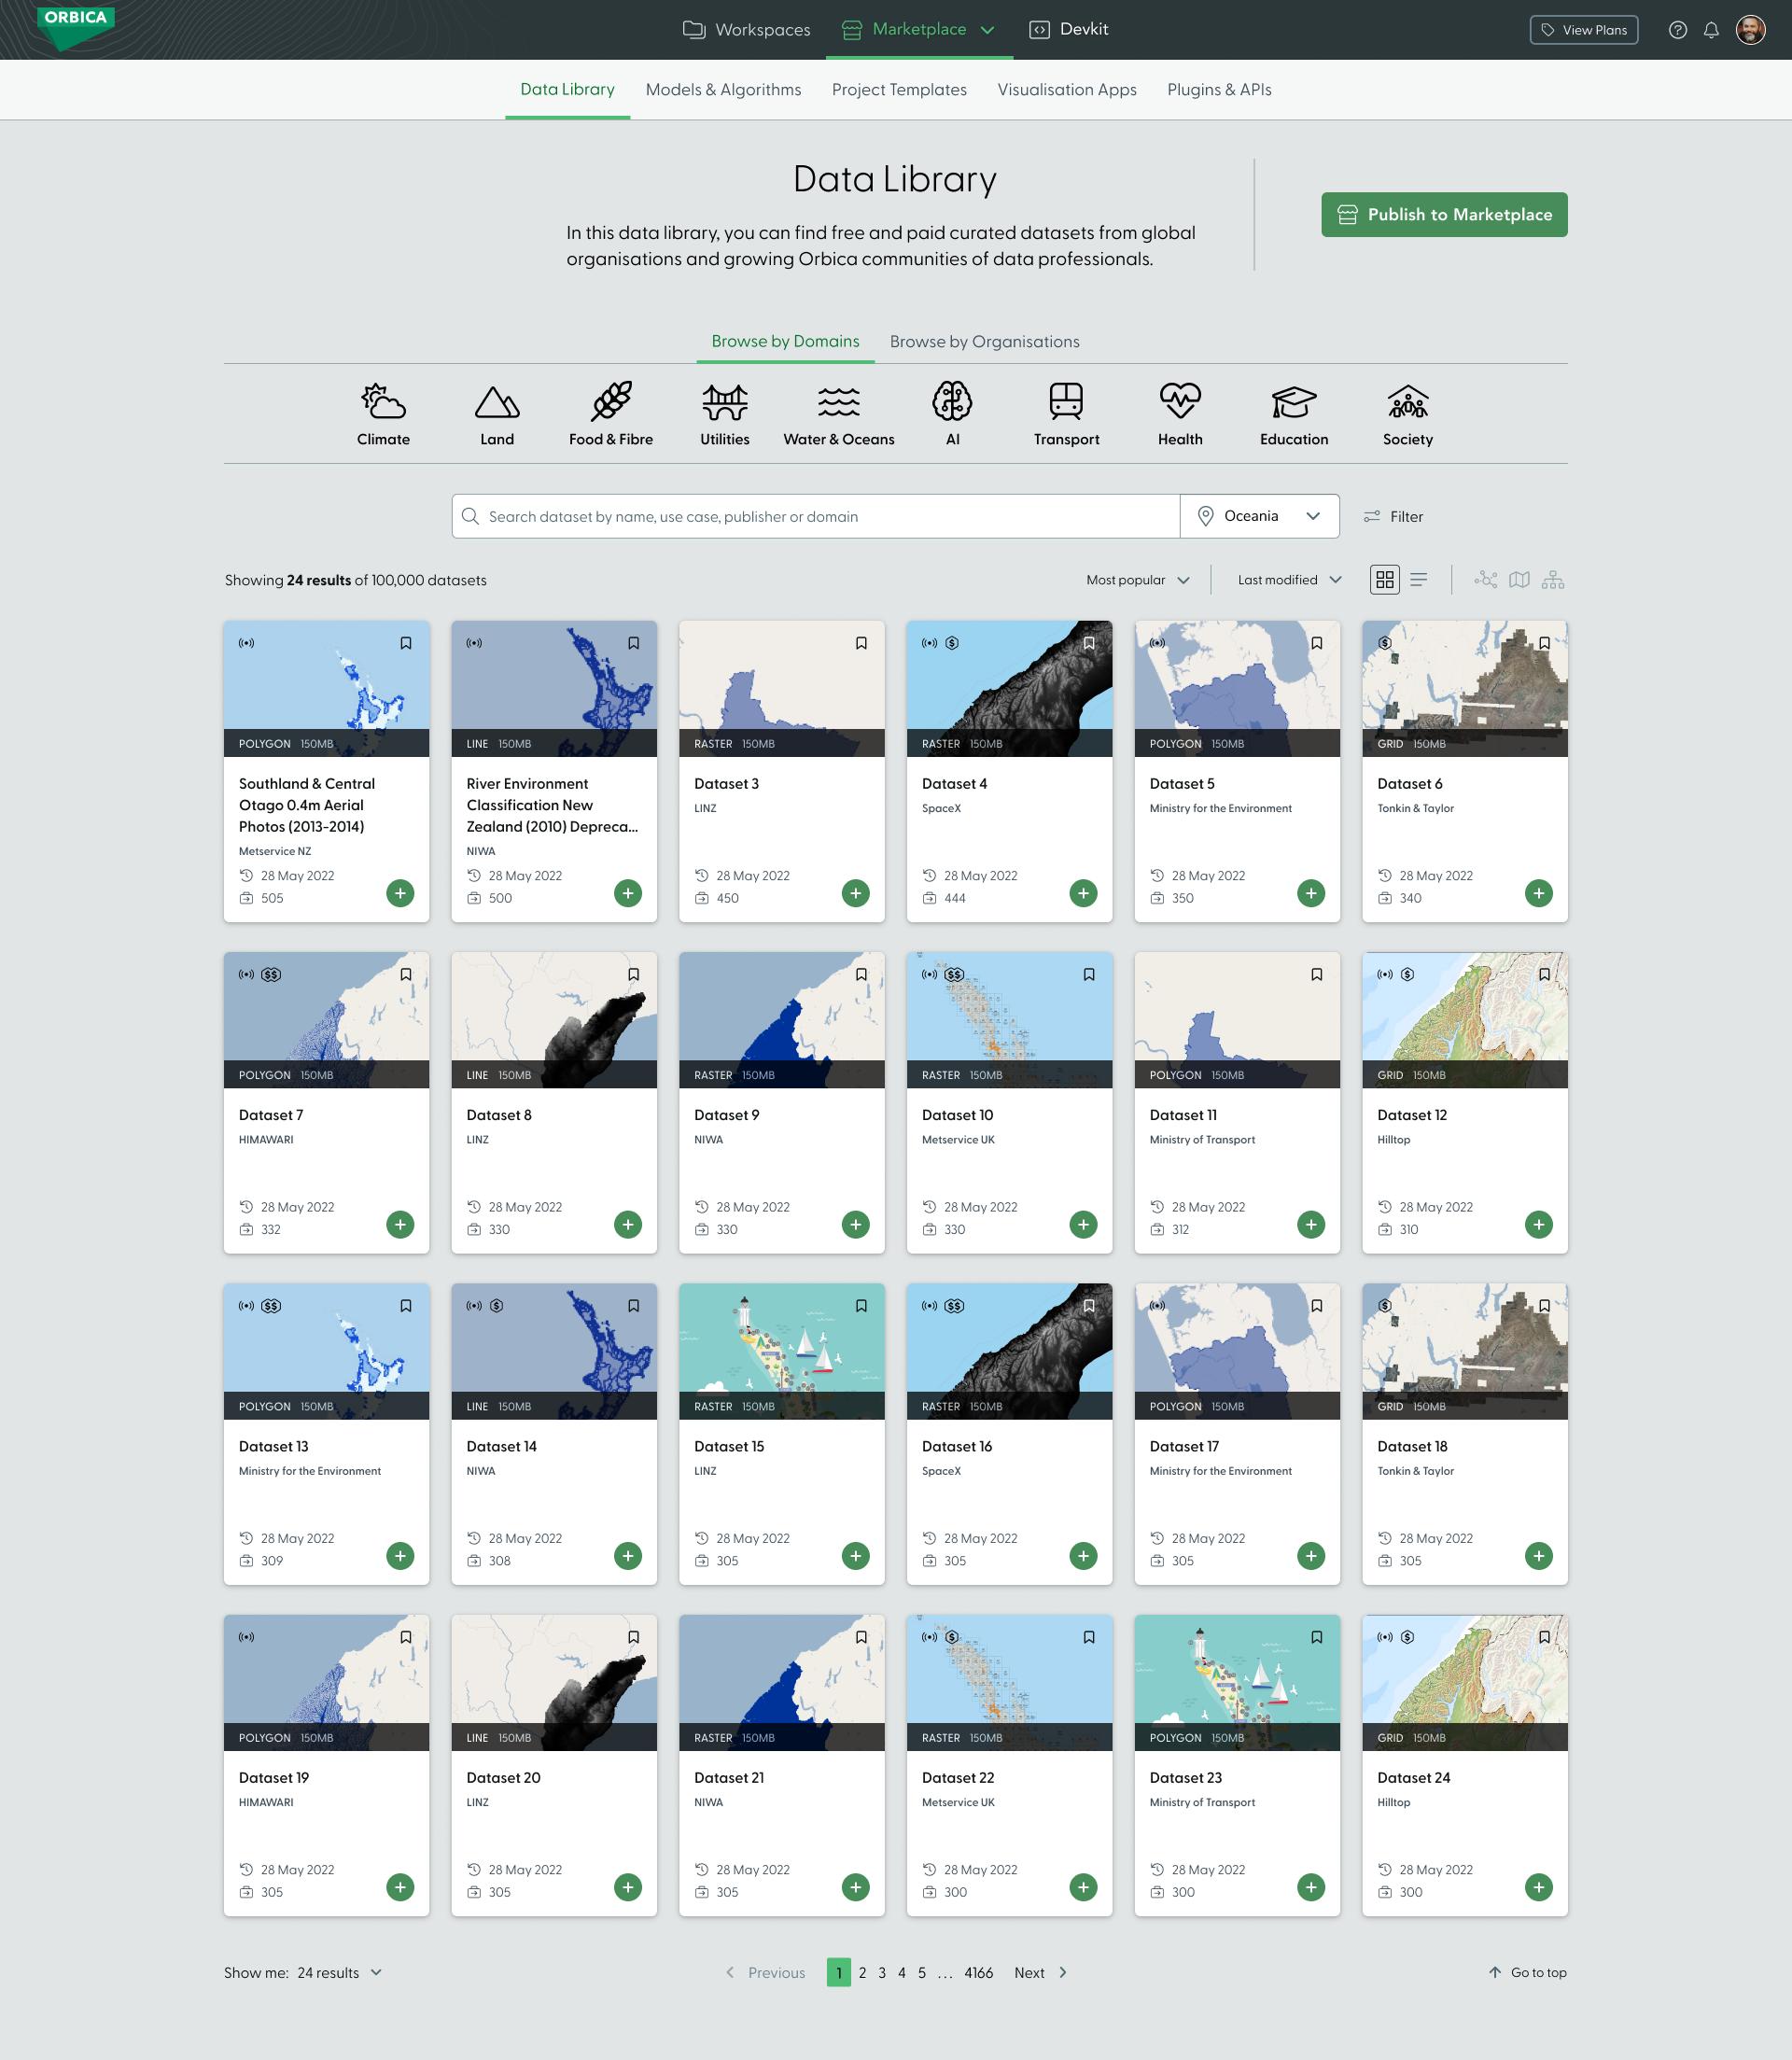
Sourcing data using charts or map view



User Testing Results
Virtually all test participants felt the platform was comprehensive, would simplify their workflow and reduce dependency on the incumbent software packages. However, there were questions around data availability, interoperability, its geo-processing capability and costs. Further user testing with the fully functional platform and real data would help clarify these concerns.
Hi-Fi UI Design
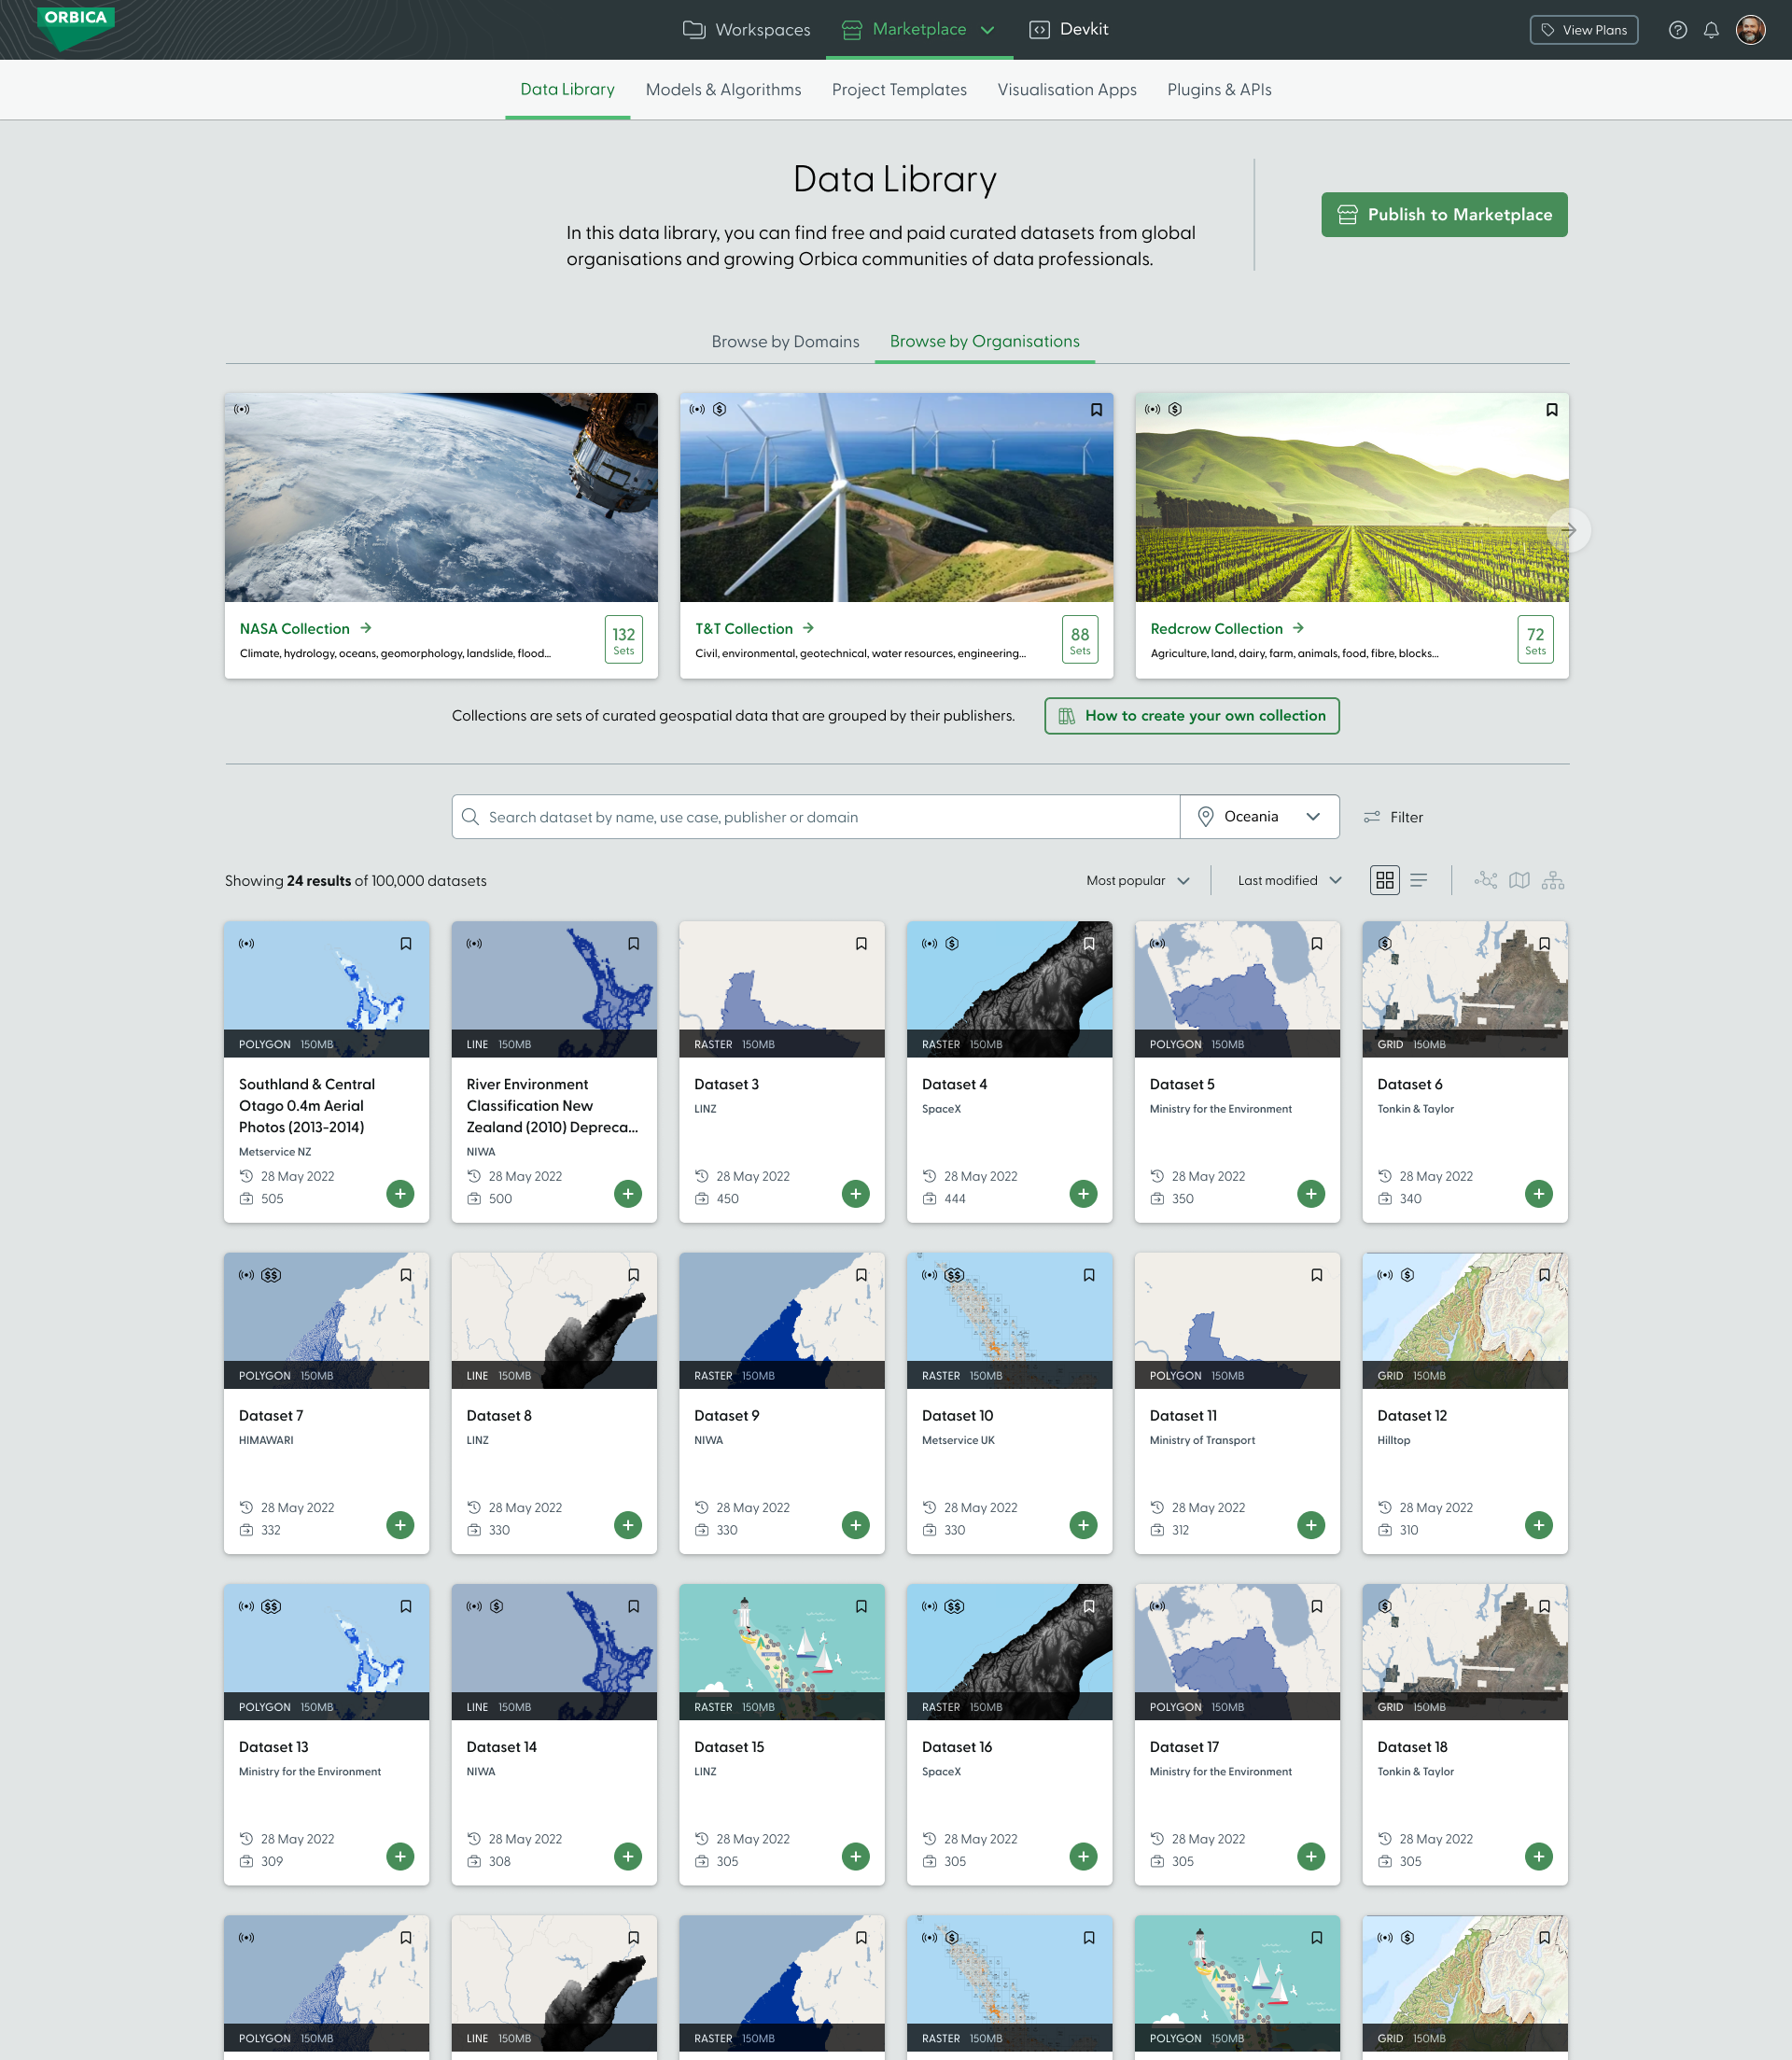
Next, I designed the Platform’s main screens in high fidelity so we could start building the foundational Design System. I collaborated with the brand team regularly to align the Platform’s visual design with the new brand identity they were developing for Orbica 2.0. The UI design influenced the new brand, and vice versa.


Crafting the Orbica Design System
I first created a pattern library consisting of core design elements: typography, buttons, form fields, colour palette and other atomic level components. Then I wrote basic guidelines on how and where to use these components. They were designed to be flexible so the team can iterate them easily as the Platform evolves.
I worked closely with the front end developer while updating the product team on the Design System’s progress weekly.
the future
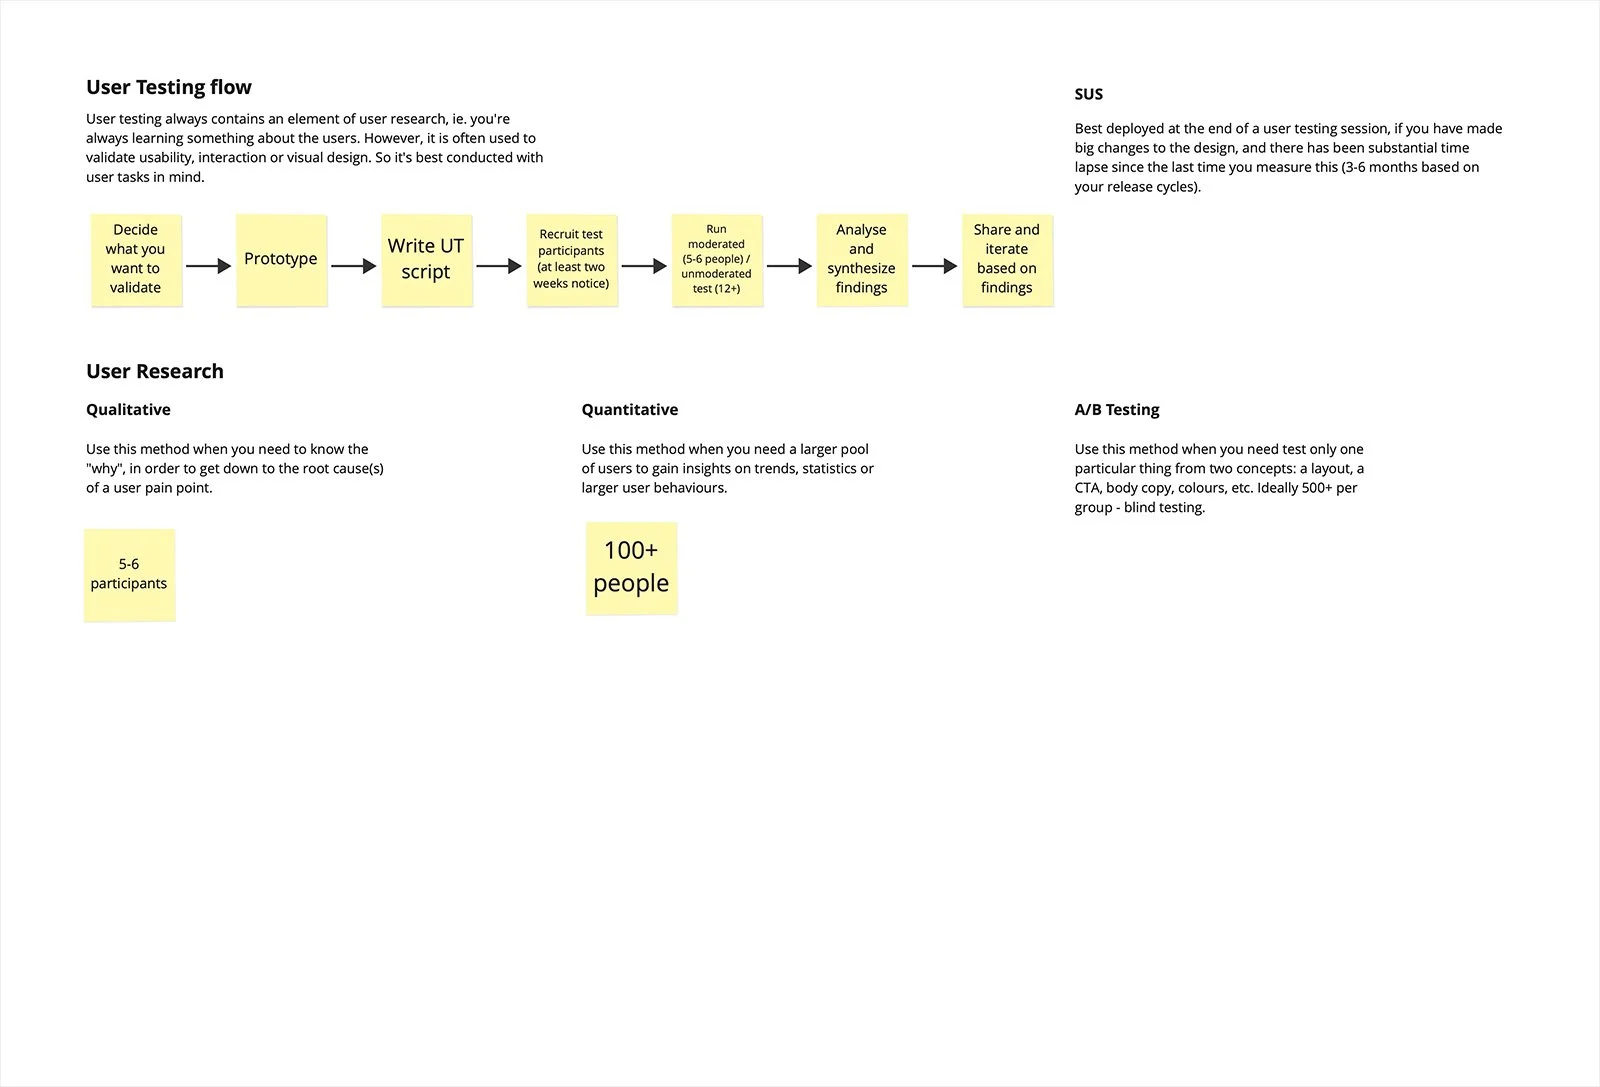
The Orbica Platform’s minimum viable experience would accommodate key user needs for data professionals such as automated geospatial data infrastructure setup, secure data hosting & governance, easy collaboration, integration with user’s preferred GIS tools and data visualisation services.
In the long term Orbica aims to establish a community of Platform developers and contributors.
As for the future, Orbica truly believes that they will reach their mission if more scientists, data professionals, policy makers and app developers embrace the full potential of geospatial insights in their works. Lastly, I presented the team with a draft strategy on how to measure the Platform’s user experience.


